This course has been running since 1997, with the exception of 2001, when Gernot was on sabbatical leave and Kevin was not yet at UNSW.
Enrolments
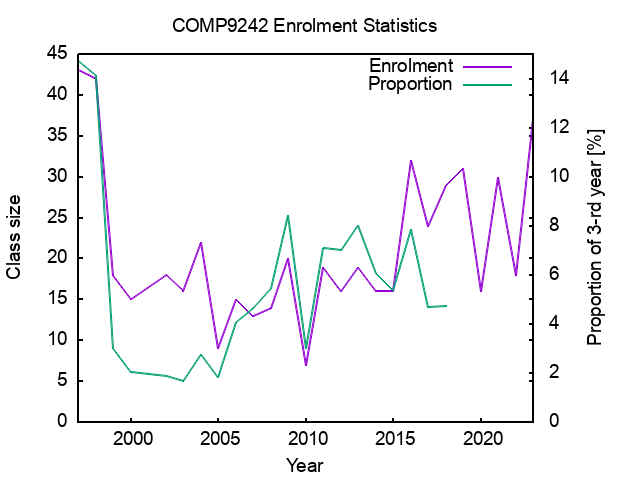
The purple line in the graph below shows actual enrolment over the years.

The first two years were special, the course had not yet earned its reputation. Also, in 1998 we introduced a prerequisite of a Credit grade in Operating Systems. From 1999 to 2002 the course had a weighting of 12UoC, all other years it was 6UoC.
Ignoring the first two years, we can see that enrolment was for many years in the 15–20 range, with only a slight post-dot-com-bust dip, unlike what was experienced my most. In COMP9242 this dip should have started to show in 2003. (Although the 12UoC rating probably depressed enrolments in the 1999–2002 period somewhat.)
If there was tech-crash dip, it reverted within a few years. Also, the OS prerequisite was toughened to a Distinction grade in 2005 (which might explain the dip that year, the only time besides 2010 that enrolment fell below 10).
This is clearly reflected in the green line in the above graph, which shows COMP9242 enrolments as a fraction of the overall size of Year-3 at CSE. Quite stable at around 2% from 1999 to 2005, the course's share of students has since grown dramatically to 5–6%, or about three times its previous long-term average, and has essentially stayed there, although it dipped to a lower level in 2010. (Note that the 2005–13 figures were revised in 2014 based on an improved treatment of double-degree enrolments, creating some inconsistencies with earlier versions of this graph.)
In 2016 the course size roughly doubled compared to the few years prior, reflecting an overall growth in enrolment in the present IT boom. Enrolment has then been remarkably stable for a number of years, partially due to an enrolment cap of 50 (many students enrol early in the year but have to drop because they do not make the prerequisite of a distinction in the base OS course).
From 2024 we raised the ceiling considerably, effectively removing it in 2025, leading to much increased enrolment.
Grade distribution
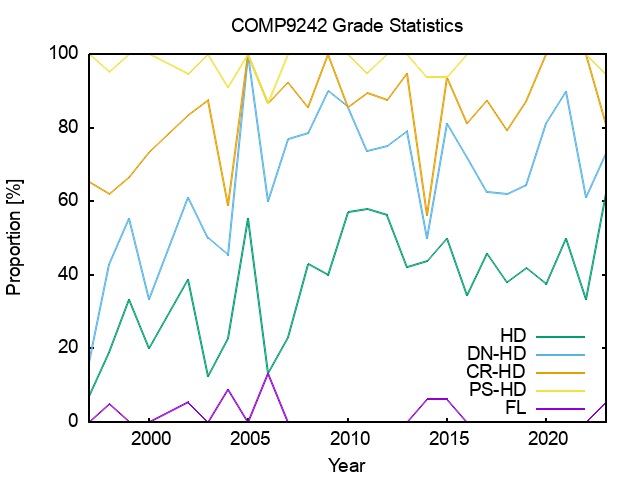
Another interesting statistics is the grade breakdown in the graph below. It is clearly evident that we do not mark to a bell curve! Instead we try to maintain uniform standards across years (and if anything, our expectations on students' performance have increased over the years). There was a clear upwards trend in the proportion of HDs and Ds over the first ten years, most likely because we were geting more students seriously interested in OS hacking, and probably also getting a higher share of the top of the student population. For the last 10+ years the proportion of HDs and Ds has been reasonably stable (and high). Students work hard in the course, and we reward them for it.

Failure rates are very low. This doesn't mean that the course is easy (as anyone who has taken it will attest, and so do the surveys), but that we take steps to ensure only students who can cope take the course (by prerequisites as well as the reputation of the course) and know they have to work hard (which they generally do).
The graph also shows that we are not afraid to hand out high marks if we think it is justified, with 100% of students in 2005 and over 75% in 2007–9 getting at least a Distinction. A number of years saw half the students ending up with High Distinction. But years like 2003 and 2006 show that we do not hand out top marks if we think they are not deserved.