| COMP9315 24T1 |
Prac Exercise 06 PostgreSQL Buffer Pool and Query Evaluation |
DBMS Implementation |
Aims
This exercise aims to get you to:- use the PostgreSQL query monitoring facilities
- start thinking about how queries are executed
- do some coarse-grained monitoring of the usage of the buffer pool
- start thinking about analysing the behaviour of the buffer pool
Background
PostgreSQL has a very useful mechanism for monitoring query execution.
The EXPLAIN
statement is an extended SQL statement that is typically run from the
SQL prompt in psql.
EXPLAIN can be used to provide information about any SQL query
that you run.
Its simplest usage is:
explain SQL_query
which prints the query execution plan that the PostgreSQL query optimiser
has developed for the SQL_query.
This plan contains estimates of the cost of query execution, including
estimates of how many result tuples there will be, but does not actually
run the query.
To get EXPLAIN to run the query and produce execution statistics,
you include the ANALYZE option:
explain (analyze) SQL_query
This prints the same information about the query execution plan as above, but also runs the query and displays extra statistics, such as the count of actual result tuples and the total execution time.
The output of EXPLAIN can be produced in a number of different
formats. The default format is plain TEXT, which is quite compact,
but also somewhat difficult to read. An alternative format (YAML)
produces output which is longer (needs scrolling) but is somewhat clearer.
You change EXPLAIN's output format using (surprise!) the
FORMAT option:
explain (analyze, format yaml) SQL_query
For this lab, we are not so much interested in the query plan as we are
in the effectiveness of the buffer pool. By default, EXPLAIN
does not produce buffer pool usage statistics,
but you can turn them on with the BUFFERS option:
explain (analyze, buffers, format yaml) SQL_query
This produces output with the same information as ANALYZE,
but with additional output describing the usage of the buffer pool, e.g.
Shared Hit Blocks: 8      +
Shared Read Blocks: 19    +
Shared Written Blocks: 0  +
Local Hit Blocks: 0       +
Local Read Blocks: 0      +
Local Written Blocks: 0   +
Temp Read Blocks: 0       +
Temp Written Blocks: 0    +
For this exercise, we are not going to be concerned about writing, and will focus on analysing buffer usage by queries. Also, we will not be concerned about each the local buffer pool managed by each query process. Neither will we be concerned about the amount of reading and writing that queries do to temporary files. In reality, of course, all of the above make a contribution to overall query cost and so are important. However, in assessing the effectiveness of buffering (our task in this lab), only the following measures are important:
-
Shared Hit Blocks: a count of the number of requests that were answered by a page already in the buffer pool -
Shared Read Blocksa count of the number of requests that were answered by reading a page from disk into the buffer pool
In a query-only environment, the sum of these two is the total number of page requests, since every request is answered either by returning a reference to a page in the pool, or by reading it into the pool and returning a reference to the newly loaded page.
Exercises
For this exercise, we'll use the university database from Prac P03. If you haven't loaded it into your PostgreSQL server, do it now:
createdb uni
psql uni -f /web/cs9315/24T1/pracs/p03/db.dump
Now, stop and restart your server:
pgs stop
Using PostgreSQL with data directory /srvr/YOU/pgsql/data
waiting for server to shut down.... done
server stopped
pgs start
Using PostgreSQL with data directory /srvr/YOU/pgsql/data
waiting for server to start..... done
server started
...
psql uni
psql (15.6)
Type "help" for help.
Whenever you start the server, the buffer pool is initialised and will be completely empty. Consider the following query, but do not run it yet:
select min(birthday) from people;
If you ran the query by mistake, stop your server and restart it, to ensure that the buffer pool is empty.
Think about what's going to happen when this query is executed,
recalling that every data page examined in a query must first be
loaded into the buffer pool.
Which pages of the people table will it fetch? How many
of these will need to be read into the buffer pool?
people relation must be examined. This means that every
page of data for the people relation must be examined.
Since none of these pages are in the buffer pool (the buffer pool
is initially empty), every page needs to be read.
xxAAxx
);?>
Now, run the query using EXPLAIN and see whether the
results agree with your answer above.
explain (analyze, buffers, format yaml) select min(birthday) from people;
           QUERY PLAN
--------------------------------
 - Plan:                       +
...
     Actual Rows: 1980         +
     Actual Loops: 1           +
     Shared Hit Blocks: 0      +
     Shared Read Blocks: 27    +
     Shared Written Blocks: 0  +
...
(1 row)
Think about these numbers. "Actual rows" tells us that 1980 tuples
from People were examined in answering this query. We
said that this should be all of the People tuples. Think
of an SQL query to check this.
Note: if your hit count was 27 and your read count was zero, you must have asked some queries on the database already. Alternatively, you loaded the database and then didn't shut the server down and restart before asking the query.
"Shared Read Blocks" tells us that 27 pages from the People
table were read in answering the query, and this should be all of
the pages in the table. Think of an SQL query to check this.
"Shared Hit Blocks" tells us that there were no buffer hits during our sequential scan of the table. This should make sense based on the fact that the buffer pool was initially empty.
Now run the same query again. This time you should observe something like:
explain (analyze,buffers,format yaml) select min(birthday) from people;
           QUERY PLAN
--------------------------------
 - Plan:                       +
...
     Actual Rows: 1980         +
     Actual Loops: 1           +
     Shared Hit Blocks: 27     +
     Shared Read Blocks: 0     +
     Shared Written Blocks: 0  +
...
(1 row)
Because the buffer pool is so large (more than 3500 pages, as we determined
in the warm-up exercise for
Prac P03), we can
fit the entire People table into the buffer pool.
Thus any subsequent queries on People will find all of its
pages already in the buffer pool.
In fact, the buffer pool is large enough to hold the entire uni
database.
Think of an SQL query to compute the total number of pages in all
of the tables in the uni database and compare this against the
number of buffers (3584).
Since there are no other processes competing for use of the shared
buffer pool (unless you're running several psql sessions)
you should observe, if you run a query repeatedly, that the second
and later runs typically require 0 reads and have a 100% hit rate.
Repeat the above process for queries on the other tables and check that (a) the number of pages read is consistent with the size of each table, (b) the buffer pool is indeed holding pages in memory for use with subsequent runs of the same query in the same invocation of the server.
Now try the following query:
explain (analyze,buffers,format yaml) select min(id) from people;
The output is much longer than for the previous example, but you only
need to worry about the first "Shared Hit Blocks" and "Shared Read Blocks".
Try to explain the results (way less than 27 page accesses).
Hints: look at the rest of the plan,
and maybe also do \d people in psql.
People.id attribute.
Looking at the \d description of People, we can see
that there is a B-tree index on this attribute. The index will contain
all of the id values from the table, and the index is much more
compact than the table. The query planner thus decides that it can more
efficiently find the minimum value by traversing the index (to the
leftmost index node) and so it reads in 3 pages from the index file
(root node, first level node, leaf node containing min value).
Since the index had not been previously accessed, the pages will not
be in the buffer and thus need to be read in.
Of course, a smarter solution would be for the query planner to know
that all of the pages of the People table were already in
the buffer pool (i.e. in memory) and count the tuples there. This would
require no disk reads at all. Unfortunately(?), the query planner is
completely separate from the buffer pool and so doesn't know this.
Now consider the query:
select count(*) from people;
This returns a simple count of the number of tuples in the People
table. Now, we know that table sizes are stored in the pg_class
catalog table, so this query could be answered by the following
simple query on the pg_class table:
select reltuples from pg_class where relname='people';
Use EXPLAIN to work out how the above select count(*)
query is actually executed.
reltuples value from the
pg_class table.
Why not? Because the reltuples value is only an approximation
to the number of tuples. It is maintained for use by the query optimizer,
which does not need an exact count of tuples. For query optimization,
a "ball-park" figure is good enough (e.g. is it 100 or 100,000?).
Now, why does it need to read the whole table? ...
Because of MVCC, a PostgreSQL data page contains a mixture of current
and deleted tuples. Deleted tuples are removed sometime after the last
transaction that had access to them has completed (by the periodic
vacuum process). Even while deleted tuples are still in the page, new
transactions cannot see them because the xmax system attribute
which tells them that the tuple was deleted before they started.
Now, a select count(*) statement is a transaction and needs
to know precisely which tuples existed when it started. The only way
it can do this is to scan the table and check the visiblity of each
tuple, counting only the ones with an xmax which is either
null or which refers to a more recent transaction (i.e. the tuple
was deleted by a transaction which happened after the count started).
All of the above queries involved just one table. Now let's look at some queries involving multiple tables. Consider first the following query which generates a list of student ids and the marks/grades they scored in each course:
select e.student,c.code,e.mark,e.grade
from   Courses c join Enrolments e on (c.id=e.course);
 student |   code   | mark | grade
---------+----------+------+-------
    3470 | MINE1010 |   60 | PS
    3470 | PHYS1111 |   60 | PS
    3470 | ARTS1090 |   63 | PS
    3470 | SOMA1651 |   60 | PS
    3472 | FINS2624 |   85 | HD
    3472 | CRIM2020 |   78 | DN
    3472 | SAHT2214 |   82 | DN
    3472 | CVEN2301 |   88 | HD
    3474 | SOCW3001 |   45 | FL
    3474 | WOMS3005 |   54 | PS
    3474 | AVEN3430 |   43 | FL
etc. etc. etc. (3506 rows)
If you run this query, you may see the tuples in a different order to the above, but you will (if you can be bothered scrolling through them) see 3506 tuples, which would include the ones above.
Note that if you don't run the above query, then you'll get differerent results from the EXPLAIN example just below. Why?
When you run the above query, it loads the pages from Courses and Enrolments into the buffer pool. When the subsequent EXPLAIN query runs, the pages are loaded. If you don't run the above query, the EXPLAINed query will need to load all of the pages while it's doing the join. xxAAxx ); ?>
If you use EXPLAIN to examine the execution costs of this
query, you will see out that includes the following (where I have
used TEXT format and greatly simplied the output for clarity):
explain (analyze,buffers)
select e.student,c.code,e.mark,e.grade
from   Courses c join Enrolments e on (c.id=e.course);

                               QUERY PLAN
---------------------------------------------------------------------
 Hash Join (e.course = c.id)
   Buffers: shared hit=29
   ->  Seq Scan on enrolments e
         Buffers: shared hit=19
   ->  Hash
         Buckets: 1024  Batches: 1  Memory Usage: 39kB
         Buffers: shared hit=9
         ->  Seq Scan on courses c
               Buffers: shared hit=9
...
What this effectively shows us is the relational algebra expression that the PostgreSQL engine uses to solve the query, which is simply:
Proj[student,code,mark,grade](Enrolments Join[course=id] Courses)
However, since it is a query execution plan, it includes additional information on how the operations such as join should be carried out. Also, it does not include details of the final projection operation. This could be displayed as a "query expression tree" as follows:
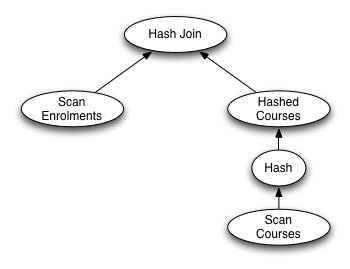
Hash join is a join algorithm that
requires at least one of the relations being joined to be in a hash
table. The first step in the above query plan is to make a hashed copy
of the Courses table, which requires a complete scan of this
table. The hash join then performs a scan of the Enrolment
table and uses the hashed version of Courses in order to
carry out the join operation efficiently.
More importantly for our purposes in this Prac Exercise are the
requests on the buffer pool.
You can see that the sequential scan on Courses visits
all 9 pages from that table, and finds all of them already in the
buffer pool. (Note that in TEXT format, EXPLAIN
only reports the non-zero counts for the buffer pool).
Similarly, the sequential scan on Enrolments visits all
19 pages of that table.
The 28 pages reported for the hash join is simply a sum of the
counts for the sequential scans.
Since there is no mention of buffer activity for the hash table,
it appears as if this is being built in memory (which is clear
from the full output for the above command if you run it in your
own psql session).
So, once again, all of the required pages are already in the buffer
pool and no disk reads are required.
Let's try a more complex query, which includes the person's name as well as their id in the course/mark/grade information:
select p.id,p.family,c.code,e.mark,e.grade
from   People p
  join Enrolments e on (p.id=e.student)
  join Courses c on (c.id=e.course);
  id  |         family          |   code   | mark | grade
------+-------------------------+----------+------+-------
 3470 | Ang                     | MINE1010 |   60 | PS
 3470 | Ang                     | PHYS1111 |   60 | PS
 3470 | Ang                     | ARTS1090 |   63 | PS
 3470 | Ang                     | SOMA1651 |   60 | PS
 3472 | Bickmore                | FINS2624 |   85 | HD
 3472 | Bickmore                | CRIM2020 |   78 | DN
 3472 | Bickmore                | SAHT2214 |   82 | DN
 3472 | Bickmore                | CVEN2301 |   88 | HD
etc. etc. etc. (3506 rows)
If run this query uing EXPLAIN we observe (once again,
the output is greatly simplified):
explain (analyze,buffers)
select p.id,p.family,c.code,e.mark,e.grade
from   People p
  join Enrolments e on (p.id=e.student)
  join Courses c on (c.id=e.course);

                               QUERY PLAN
---------------------------------------------------------------------
 Hash Join  (e.course = c.id)
   Buffers: shared hit=56
   ->  Hash Join  (e.student = p.id)
         Buffers: shared hit=46
         ->  Seq Scan on enrolments e
               Buffers: shared hit=19
         ->  Hash
               Buffers: shared hit=27
               ->  Seq Scan on people p
                     Buffers: shared hit=27
   ->  Hash
         Buffers: shared hit=9
         ->  Seq Scan on courses c
               Buffers: shared hit=9
...
The query plan involves two hash joins and can be represented by the following query tree:
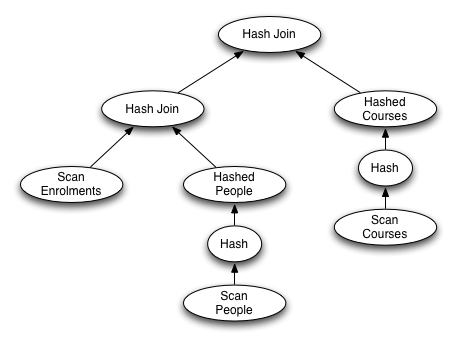
From the EXPLAIN output, we can see each table is scanned once
in executing this query: scan 9 pages from the Courses table to
build an in-memory hash-table, scan 27 pages of the People table
to build another in-memory hash table, scan 19 pages from the
Enrolments table to join with People and then join
the result of that with the Courses hash table.
This gives a total of 55 disk page requests, all of which can be
resolved from the buffer pool, because all tables are stored in the
buffer pool (assuming that you asked queries on all tables earlier).
Smaller Buffer Pool
The above results show that DBMSs tend to use a very large buffer pool to keep as much data as possible in memory. With a small database such as ours, the whole DB eventually ends up in the buffer pool. Of course, we know that for a realistic sized database, the buffer pool will eventually fill up and further page requests will require pages already in the pool to be removed. In order to observe such effects, we need a much smaller buffer pool.
The pg_ctl command allows us to send configuration options to the
PostgreSQL server, as we saw in
Prac P03.
This involves the use of the -o option to pg_ctl and an
argument containing the options to be sent to the backend, e.g.
pg_ctl start -o '-B 100' -l /srvr/YOU/pgsql/log
server starting
The above command starts the PostgreSQL server with a much smaller buffer pool than usual (100 pages, rather than 3584). The complete set of options for configuring the server is described in Chapter 18 of the PostgreSQL documentation.
Stop your PostgreSQL server and restart it with a very small buffer pool:
pg_ctl stop
waiting for server to shut down.... done
server stopped
pg_ctl start -o '-B 32' -l /srvr/YOU/pgsql/log
server starting
psql uni
...
Run the following query, with EXPLAIN output:
explain (analyze,buffers,format yaml) select * from courses;
           QUERY PLAN
--------------------------------
 - Plan:                       +
...
     Actual Rows: 980          +
     Actual Loops: 1           +
     Shared Hit Blocks: 0      +
     Shared Read Blocks: 9     +
     Shared Written Blocks: 0  +
...
(1 row)
As we'd expect, the buffer pool starts empty (we just restarted the server)
and we need to read every page from the Courses table into the buffer
pool in order to answer the query.
Now try the same query again. What would expect to happen? As above, we might
expect "Shared Hit Blocks" to be 9 and "Shared Read Blocks" to be 0, since all
of the pages from Courses are already in the pool.
In fact, what you might observe is the following:
explain (analyze,buffers,format yaml) select * from courses;
           QUERY PLAN
--------------------------------
 - Plan:                       +
...
     Actual Rows: 980          +
     Actual Loops: 1           +
     Shared Hit Blocks: 4      +
     Shared Read Blocks: 5     +
     Shared Written Blocks: 0  +
...
(1 row)
Or, you might see the same as the original query (9 reads, zero hits).
What's going on here? The Courses pages were read into the pool,
but now at least some of them seem to have been removed. Try to think of
an explanation for this.
Now ask the same query again several more times in quick succession to see what the results are. You may see something like:
explain (analyze,buffers,format yaml) select * from courses;
...
     Shared Hit Blocks: 4      +
     Shared Read Blocks: 5     +
...
explain (analyze,buffers,format yaml) select * from courses;
...
     Shared Hit Blocks: 8      +
     Shared Read Blocks: 1     +
...
explain (analyze,buffers,format yaml) select * from courses;
...
     Shared Hit Blocks: 9      +
     Shared Read Blocks: 0     +
...
Can you explain this behaviour? If you know the details of the PostgreSQL buffer pool management code, you should be able explain it. But given that you probably don't at this stage, it would help if we had access to more detailed information about buffer pool usage than a simple summary at the end of each query. Prac Exercise P05 looked at detailed buffer usage, but not, of course, in the PostgreSQL context.
In the meantime, you should try running each of the queries from the first part of this Exercise on your new server instance. Compare the results from earlier with the results you get with the much smaller buffer pool.
Postscript
Throughout this exercise, we have considered only the shared buffer pool. This pool is used by all processes running on the PostgreSQL server to hold any data read in from the database. However, the shared buffer pool is not the only place where data is manipulated. Each server has its own private buffer pool for holding intermediate results during query execution. These would need to be considered to build a up a complete picture of the disk access patterns for one query execution.
End of Prac
Let me know via the forums, or come to a consultation if you have any problems with this exercise ... jas