.png)
| Semester 1, 2018 |
| Faculty: Faculty of Engineering |
| School: School of Computer Sci & Eng |
| Course: COMP3231 Operating Systems |
| Evaluation period: May 14 2018 12:00AM - Jun 7 2018 12:00AM |
Course Report |
Response Data |
| Raters | Student |
|---|---|
| Responded | 68 |
| Invited | 288 |
| Response Ratio | 23.6% |
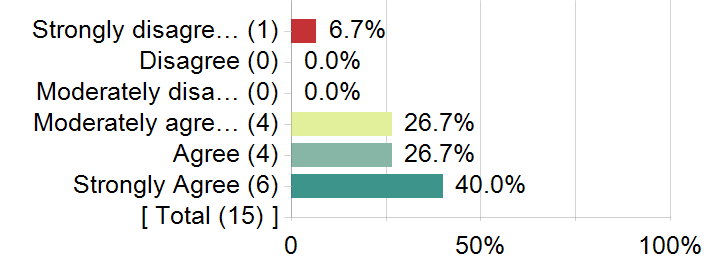
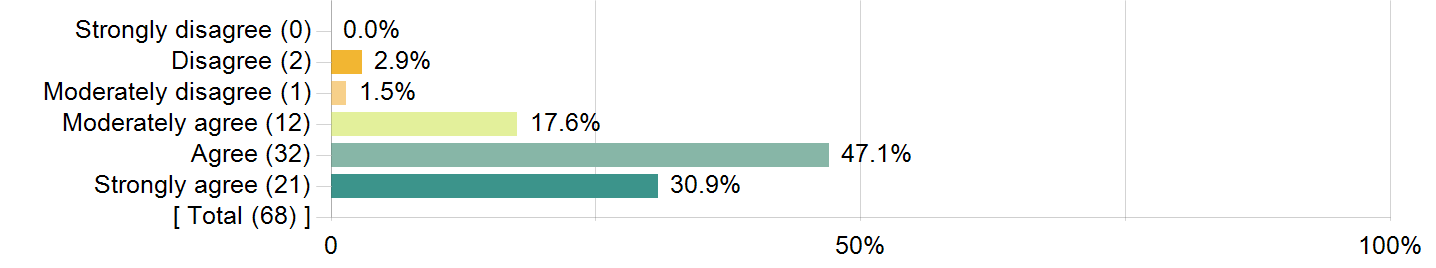
Comparison of results for "Overall I was satisfied with the quality of the course"
This course: COMP3231 Operating Systems
| Options | Count | Percentage |
|---|---|---|
| Strongly disagree | 0 | 0.0% |
| Disagree | 2 | 2.9% |
| Moderately disagree | 1 | 1.5% |
| Moderately agree | 12 | 17.6% |
| Agree | 32 | 47.1% |
| Strongly agree | 21 | 30.9% |
| Statistics | Value |
|---|---|
| Mean | 5.01 |
| Median | 5.00 |
| Standard Deviation | 0.91 |
| Standard Error (base on SD) | 0.11 |
| % Agreement | 95.6% |
SCHOOL: School of Computer Sci & Eng
| Options | Percentage |
|---|---|
| Strongly disagree | 3.5% |
| Disagree | 4.2% |
| Moderately disagree | 5.6% |
| Moderately agree | 16.9% |
| Agree | 39.0% |
| Strongly agree | 30.9% |
| Statistics | Value |
|---|---|
| Mean | 4.76 |
| Median | 5.00 |
| Standard Deviation | 1.26 |
| Standard Error (base on SD) | 0.02 |
| % Agreement | 86.7% |
FACULTY: Faculty of Engineering
| Options | Percentage |
|---|---|
| Strongly disagree | 3.1% |
| Disagree | 3.4% |
| Moderately disagree | 5.1% |
| Moderately agree | 16.9% |
| Agree | 41.9% |
| Strongly agree | 29.7% |
| Statistics | Value |
|---|---|
| Mean | 4.80 |
| Median | 5.00 |
| Standard Deviation | 1.19 |
| Standard Error (base on SD) | 0.01 |
| % Agreement | 88.4% |
Overall I was satisfied with the quality of the course
| Statistics | Value |
|---|---|
| Mean | 5.01 |
| % Agreement | 95.6% |
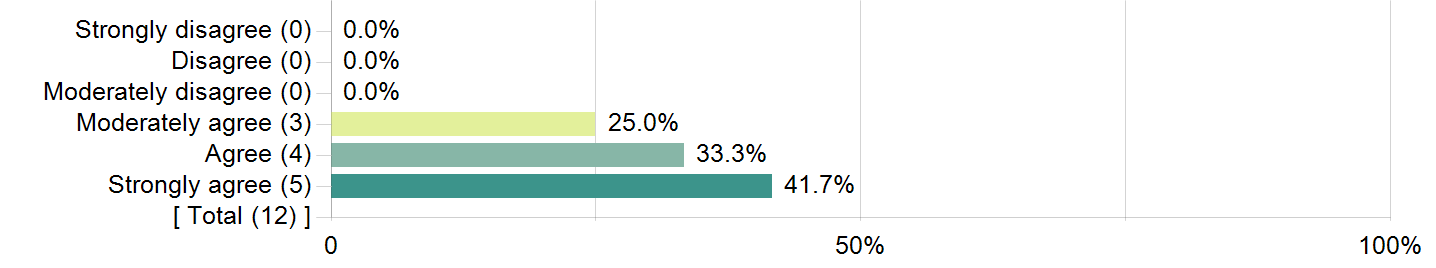
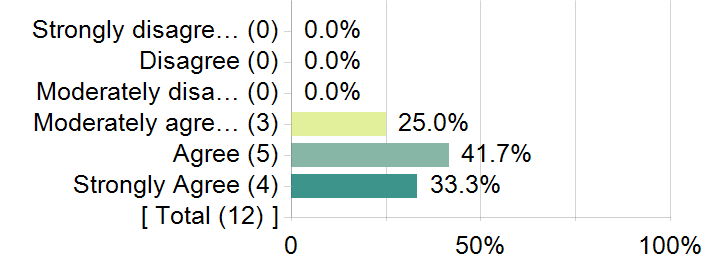
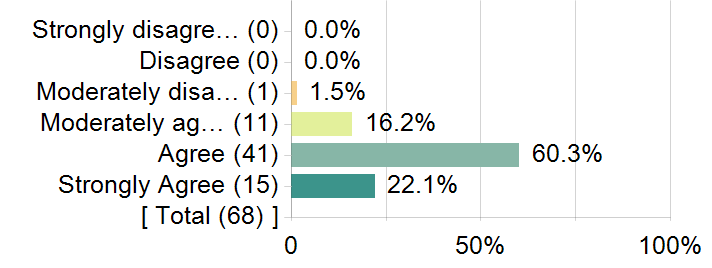
1. I felt part of a learning community
| Statistics | Value |
|---|---|
| Mean | 4.78 |
| % Agreement | 94.1% |
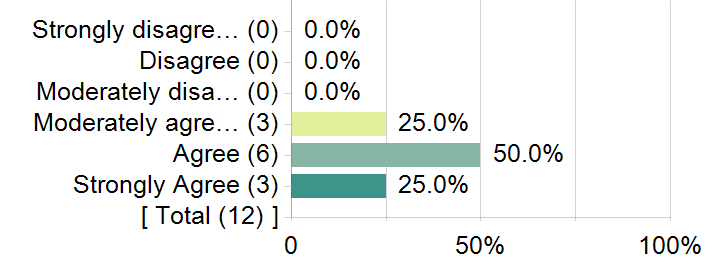
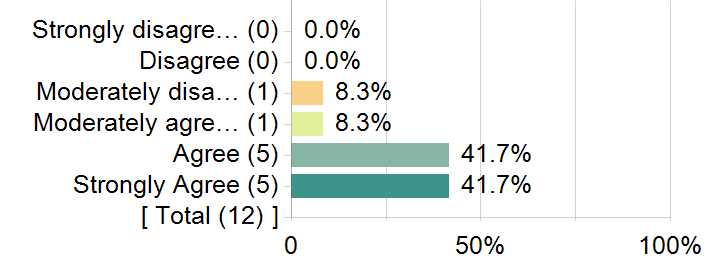
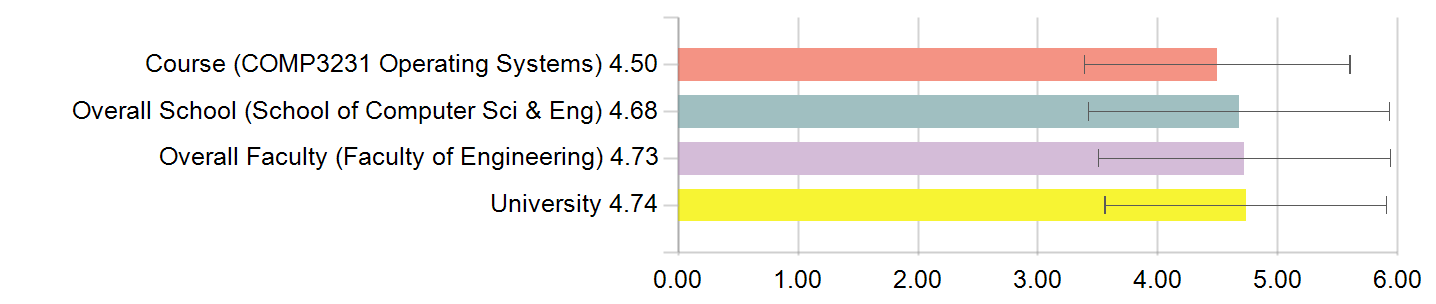
2. The feedback helped me learn
| Statistics | Value |
|---|---|
| Mean | 4.50 |
| % Agreement | 86.8% |
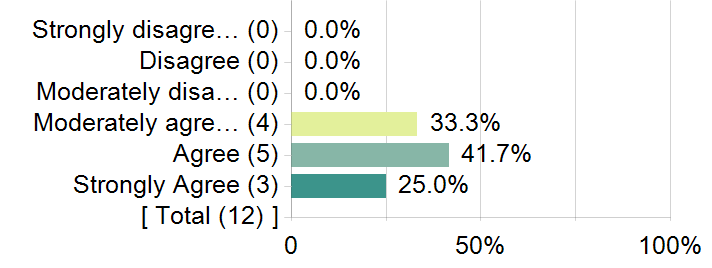
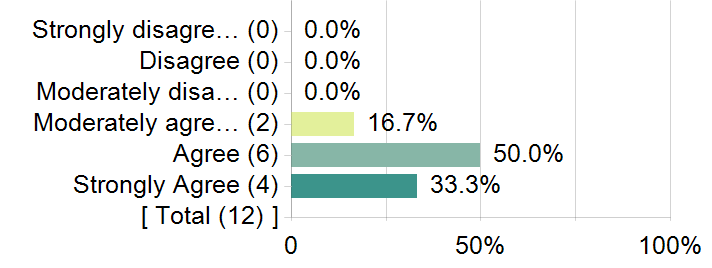
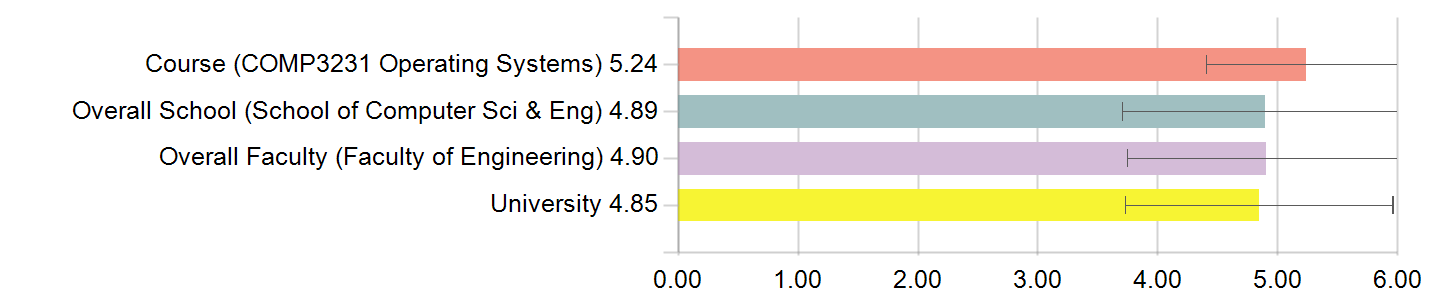
3. The digital resources helped me learn
| Statistics | Value |
|---|---|
| Mean | 5.24 |
| % Agreement | 97.1% |
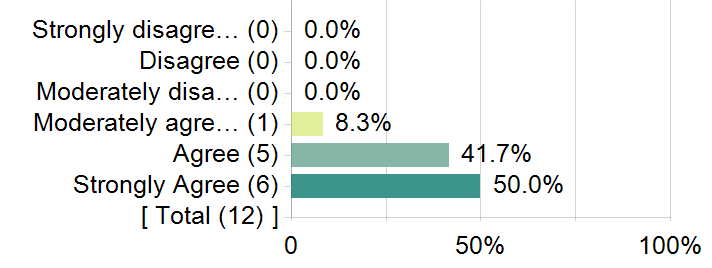
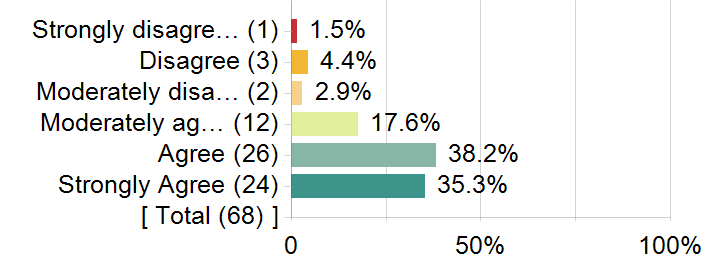
4. The assessment tasks were appropriate
| Statistics | Value |
|---|---|
| Mean | 5.03 |
| % Agreement | 94.1% |
5. The amount of assessment was appropriate
| Statistics | Value |
|---|---|
| Mean | 5.03 |
| % Agreement | 98.5% |
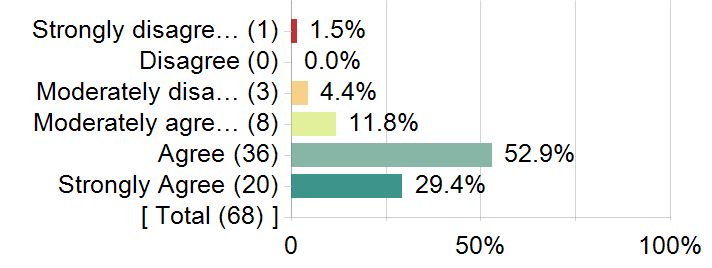
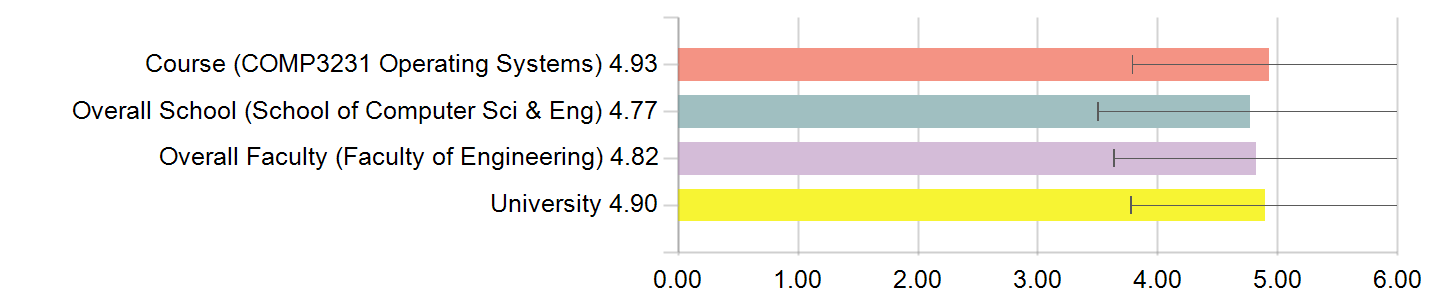
6. Overall I was satisfied with the quality of the teaching
| Statistics | Value |
|---|---|
| Mean | 4.93 |
| % Agreement | 91.2% |
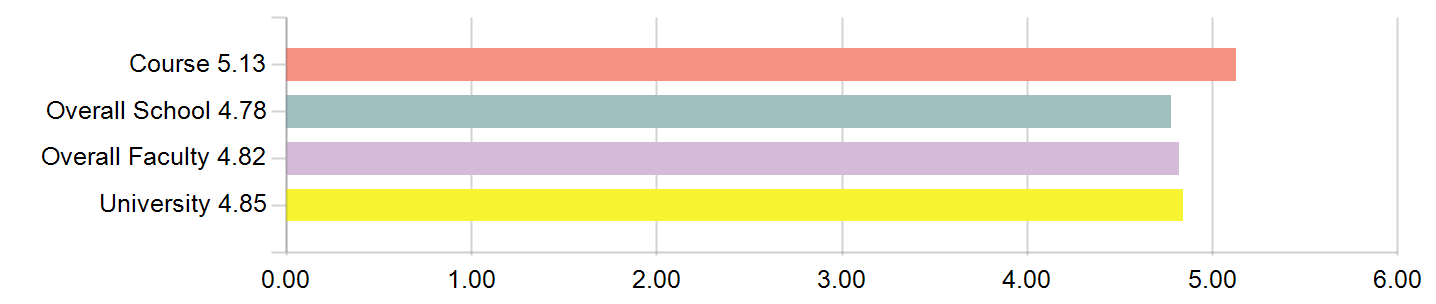
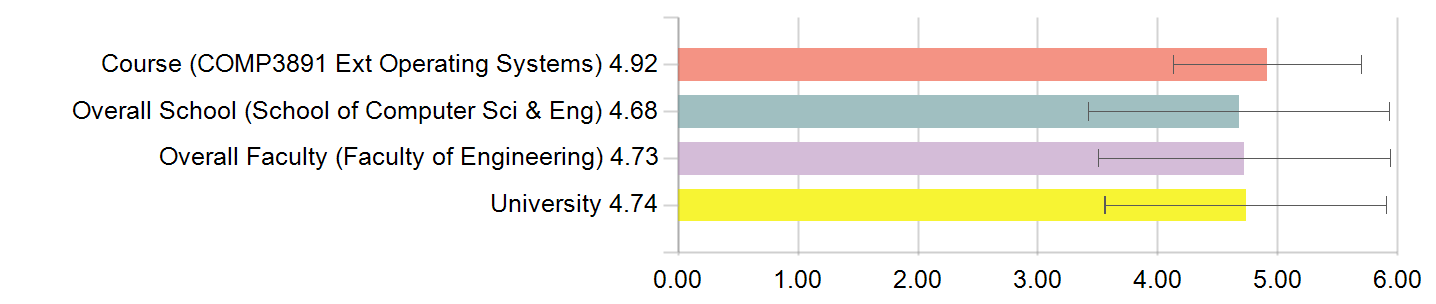
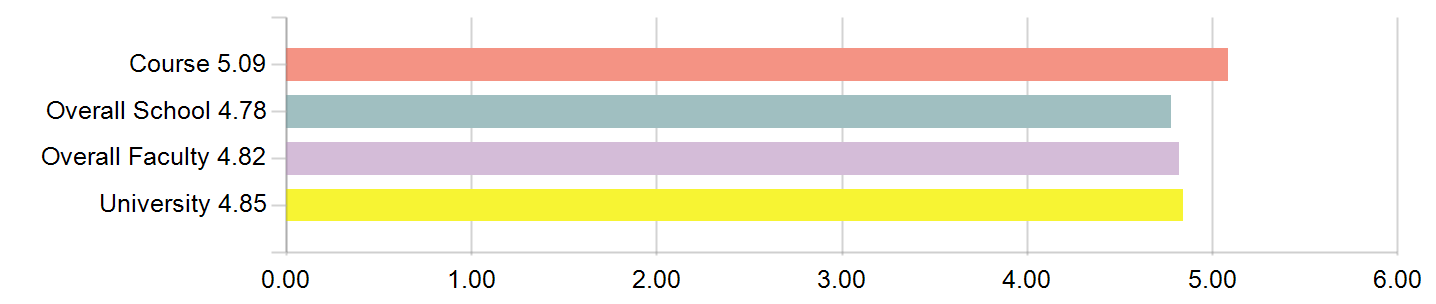
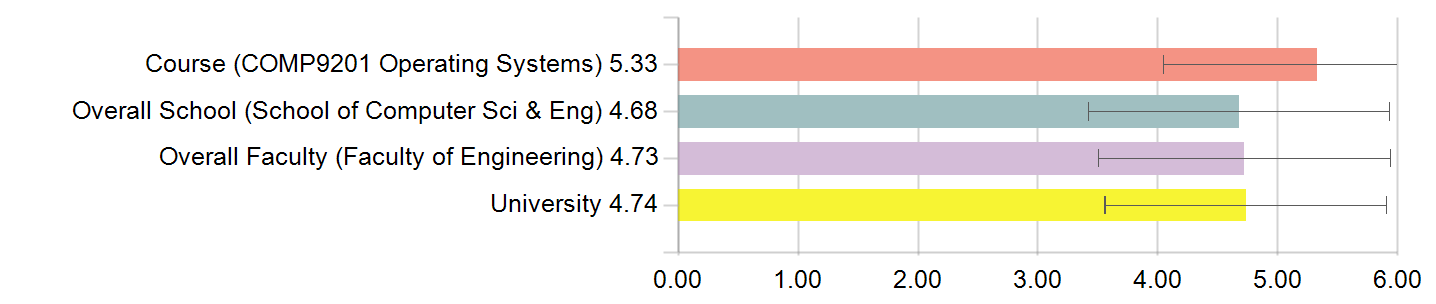
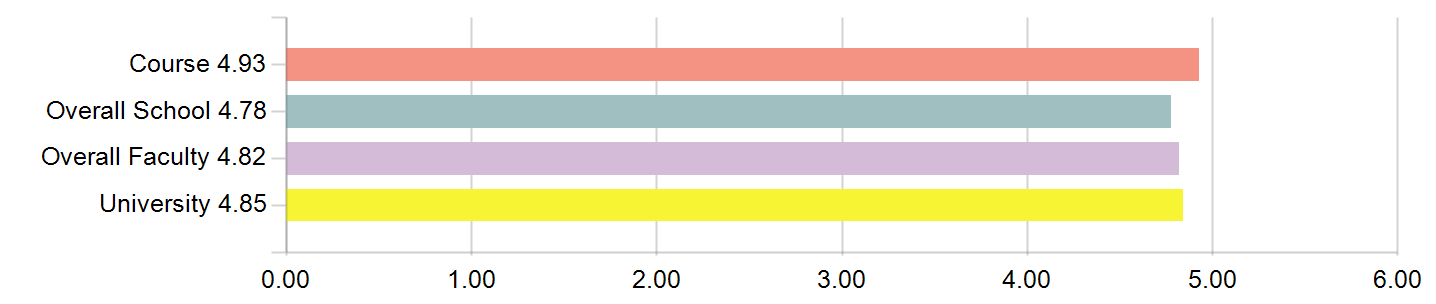
Comparison Statistics
Mean (average student responses between 1 and 6) and StandardDev (Standard deviation of student responses) are used for comparison statistics between Course, School, Faculty and University.

Mean across all responses
1. I felt part of a learning community

2. The feedback helped me learn
3. The digital resources helped me learn
4. The assessment tasks were appropriate

5. The amount of assessment was appropriate

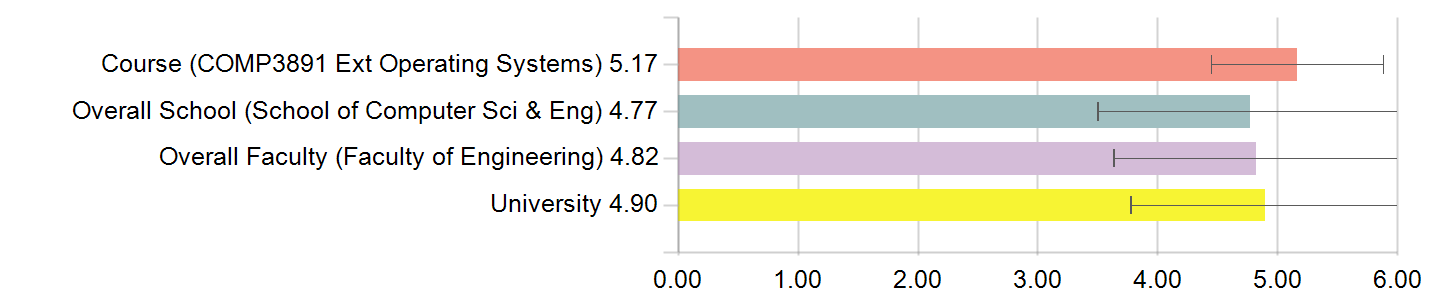
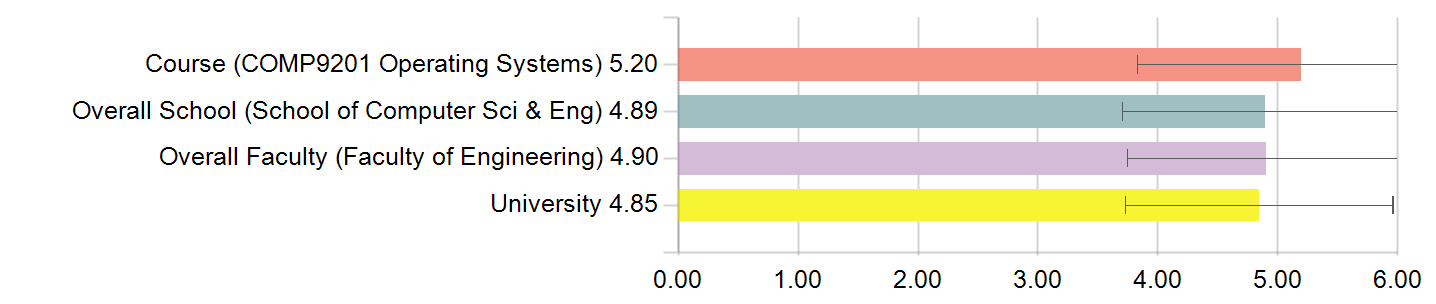
Comparison Statistics (continued)
Mean (average student responses between 1 and 6) and StandardDev (Standard deviation of student responses) are used for comparison statistics between Course, School, Faculty and University.
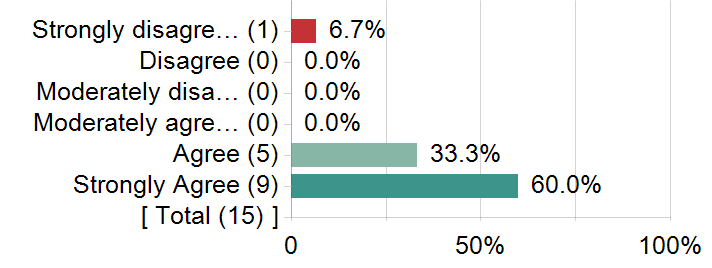
6. Overall I was satisfied with the quality of the teaching
7. Overall I was satisfied with the quality of the course

Raw Comment Data
What were the best things about this course?
| Comments |
|---|
| – Assignments were very step–by–step, everything is explained very clearly. The familiarization exercises for each assignment were also very helpful, and was a nice slow introduction to the task we had to do, and the "how to setup" steps for each assignment were also very helpful. – Piazza was very helpful, tutors responded very quickly – Lecture slides were helpful; diagrams gave a clear understanding of important concepts – Early bonus encouraged early submission, and the late penalties were lenient – Submission guidelines and course wiki helped immensely |
| Access to previous semester's resources (tutorials, lecture videos) Online recorded lecture videos which are small in size but high quality |
| The lecturer |
| It goes through very fundamental concepts of Computer Science. |
| Really good overview and interesting content, concepts were clear. |
| Good content, well thought out. Challenging assignments. |
| The assignments and lecture notes were very good |
| For the time Kevin was the lecturer, I think he is one of the best lecturers I've had. He is very easy to follow and clear and he goes through material with very good flow or pace if that makes sense. The assignments looked very intimidating at the start but when you start to make progress you start to gain confidence and you gradually progress through the assignment and I've manage the hand in my assignments a week early every time to ensure the one week early bonus which is a very good incentive. |
| Interesting topics |
| The video lecturers were of a great quality. The forum was used well and beneficial to understanding the content. The wiki and having answers to tutorials available online was very beneficial. |
| The content is pretty interesting and gives you a deep understanding about how computers actually work, how programs run, how the OS facilitates everything for user–level programs. It gives us an appreciation of how important the OS is and how easy it makes user–level programming. The assignments are quite useful in strengthening the understanding about OS concepts. |
| The content was very interesting, and gave a very good understanding of how an OS worked. |
| The assignment are really chanllenging and help me to learn a lot. |
| Using OS/161 as a base was helpful becaues it showed an example of a very basic real life operating system. |
| Interesting. Also good lecturer. |
| The assignments were fun, course content allowed me to learn new things and really draw my attention in. |
| Good content to know. |
| The content. It is so interesting |
| Forum, in particular the instructors who replied to questions very regularly. And also the whole team for keeping the course running well even throughout the difficulties. The content was quite interesting. |
| great recordings |
| The lecture slides and the recordings, and the specifications of assignments are so clear and understandable |
| interesting assignments |
| Learning about the workings of the operating system, something I did not |
| The digital resources are great! I like how the lecture recordings include the annotations that Kevin makes on the slides. The diagrams and explanations included on the slide are also appropriate. The course website is structured cleanly and everything is easy to find. The best thing was probably the Piazza forums. Nuno and Alex respond super quickly to all of the questions I post and always do so in a welcoming way so I don't feel stupid for asking the question. |
| Getting experience designing and building complex low–level systems |
| This course was interesting, engaging and I felt it covered the relevant topics of Operating Systems. |
| The course was challenging to an appropriate extent. The course material was delivered in a clear and engaging manner. Assessment tasks were challenging but highly rewarding and not too difficult. The use of the Piazza forum was EXTREMELY helpful for the completion of assessment tasks |
| The assignments were great, got to apply what we learnt. |
| Well presented content and challenging assignmnets |
| Provided vital knowledge that every computer science student should know. The first two assignments really nicely stepped through concepts and built up your knowledge as you progressed, rather than dumping you in the deep end. Timely feedback from assignments was invaluable. The provided lecture videos allowed me to work my part time job whilst studying the course. These videos were of excellent quality. The bonus mark incentive for early submissions. |
| Content is taught well at an appropriate pace, instructors are responsive on piazza. The bonus for 10% early submission on assignments is great. The custom made lecture recordings are fantastic quality. |
| Useful content, overall pacing between each topic is good. The piazza forum is useful when I'm stuck on something and wondering if anyone else experienced similar issues. |
| Great insight into the ways operating systems are maintained, analyzed and problems solved. |
| Very well run course, interesting content. Especially given the circumstances |
| Lecture videos were all recorded and available online |
| Appropriate assessments, very interesting content, I enjoyed it! :) |
| Very hands–on and to–the–point content. I felt like the content was relevant to everyone in the course, and the course was structured and paced very well. |
| It revealed to me the world of "OS junkie". I had the opportunity to see a corner of the industry that really tickles the nerd in me. I also REALLY appreciate that there was major problems outside of the staffs control, and how the course wont on despite this. |
| The lectures were really high quality and the lecturer knew what he was talking about and was really passionate. If we wanted to we could go in lots of depth about certain topics We got to work on a real OS |
| the assignments were really good. practical work using the system |
| The programming tasks. The information is also useful. |
| Very interesting content and the assignments gradually became more challenging which was a good thing. |
| Very structured, no real surprises. The course content made sense and was explained well. Assignments were difficult but fair |
| Lecture slides + assignments |
| Lecture recordings, Assignment walkthrough slides and video recordings, Flow of content. |
What could be improved?
| Comments |
|---|
| – Piazza could be organized by topic a little better, though that's largely a fault of the students (e.g. asking multiples of the same question) |
| Nothing |
| The code provided doesn't follow any good coding practices – sometimes spacing is spaces and sometimes its tabs. sometimes its 4 spaces and sometimes its 8. Variable names are occasionally poorly chosen. I mean, come on. This is not the first time the course is being run, is it? A fair few times, comments have been left out of important code sections, which is not helpful if we are being made to deal with a large codebase. I am not sure why we were asked to use SVN over Git. In my experience, significantly more people know git than svn. |
| Assignments are hard :( but I don't think there is an improvement to be made, except maybe a bit more guidance... Unless the struggle is part of the experience? Part of the difficulty was that lectures are hugely theoretical but actually putting it into practice with code could be hard (especially knowing what code goes where)... But again, might just be part the experience/requirement for prereq. |
| Course was a bit of a disaster with the LIC leaving halfway through the semester. Obviously this was out of the control of anyone, but it wasn't ideal for those doing the course. |
| The first assignment had so much time given to it, but the last assignment we have hardly 2 weeks to complete it to reach the early bird mark, although the last assignment is clearly harder than the 1st |
| n/a |
| Having visited two different tutorials I felt the method of teaching was quite varied. |
| The tutorials seem to be lacking in depth and structure. The tutor knew the content pretty well, but I felt like he would just rehash what was done in lectures. So maybe the tutorial questions need to be improved. I think there's a lot of repetition between tutorials and lectures. Please provide the PowerPoint sources for your slides – it makes it easier for us to extract material, images etc for our own notes/summaries. The course website could be improved. Seems like there's a lot of different platforms used – Piazza, the wiki and so many links and pages on the main course site. It's a bit all over the place. I think everything needs to be restructured so we don't miss important information/resources. It sounds odd that the assignment walkthroughs were done only in the "extended" lectures even though they are incredibly important for the base course students as well. Some of the topics covered in the course went into way too much detail relating to the hardware/computer architecture. This should be covered only at a high level and not in detail. This was particularly the case in the second half of the course. Assignment marking could have been more prompt but bearable in comparison to other courses that are much less organized. Overall, it seems that there is a lot of content in this course, even for a third–year course. Compared to other third–year courses (like networks, databases and algorithms), this course had the most content and most to learn in the same amount of time. Perhaps some topics could be either cut or condensed to some extent – this will be essential for next year due to the unfortunate decision to proceed with "trimesters". Also, I understand that there were problems with lectures this year. However, even without these problems, I still think that due to the amount of content (and significant depth), the topics aren't covered "quickly" enough to keep up with the assignment schedule. The content relevant to each assignment (all 3 assignments in fact) was essentially not covered fully until the week or two after the corresponding assignment was released. So, students had to get ahead with lectures in order to do the assignments. Without last year's recordings, this would've been impossible and starting the assignments early/on time would've been difficult. Overall, the assignment schedule and lecture content need to rethought and aligned better for next year (especially due to the disastrous "trimesters"). |
| The last assignment really needs better coverage of the content; was very difficult what it was we were meant to do to get the assignment to pass the tests. |
| The lecture covered too much theoretical stuff. I think more code work through or live coding would be helpful. |
| The second and third assignments were still quite daunting and difficult to start, but I don't think much more could be done to solve that problem. The group system could be improved, providing more options (listed in the assignment spec) for students with partners who do not contribute equally. |
| Each assignment is too much. It takes really long time to finish. Slides don't explain clearly and is hard to understand, resulting wasting a lot time to understand a rather easy content. |
| n/a – Possibly be a little more rigid in the course content |
| Admin could have been better. Knowing Kevin's personal condition, there could have been some preempt in getting a replacement lecturer. |
| The order of lectures could be improved so that the timing of each lecture is closer to the relevant assignment. For example, we went over syscalls in the first week but the assignment on syscalls was in the middle of the semeseter. Also, it would be better if the lectures on the VFS and what we need to know to complete assignment 2 where before the case studies and filesystems lectures, which would have helped with assignment 2. |
| Don't have group assignments. They did not really require a group effort to complete them |
| I ended up doing all of assignment 3. That was a lot of work. My partner kept saying he would do work but never did what he said he would. Also, would really appreciate space bar to pause and arrow keys to fast forward 10 seconds or rewind 10 seconds in the lecture recordings. |
| nothing |
| tutors giving more detailed answers instead of referring to lecture notes |
| Lectures more tailored to the assignments. For assignment 2 and 3, I felt that the lectures leading up to it were not descriptive enough in terms of guiding you to a solution for the assignments. There was a lot of time wasted due to the fact that my partner and I were not able to fully understand what the assignment required us to implement. |
| I think the tutorials could be structured to be more interactive. With courses that have tut/labs, it's ok for the tutorial to be more one–sided since the lab was where you had a chance for 1 on 1 time with the tutor. I felt that most of my contact hours were quite passive, but I spent lots of time on assignments outside of class struggling with things that would have been less painful if there was a tutor walking around to answer questions. Maybe help sessions would be useful. |
| The direction in which the diagrams of memory are drawn |
| The lectures are very content–heavy, making it feel rushed at times. |
| The teaching of more modern OS concepts than what we currently learn |
| Last assignment spec was quite vague and occasionally mixed terms up making it more confusing. Was a shame lectures were unable continue but for good reason |
| explain more about the assignment |
| There was little to no downtime between assignments. The workload/time required for the assignments was quite large relative to their weighting and the existence of a final exam. The late penalty being subtracted from the maximum mark rather than the students mark, in line with other computing subjects. This would help support those students who struggle/find the course very difficult and would never get full marks anyway. For example, I found myself caught in a rabbit hole with concurrency issues or pointer issues and I really really wanted to get it all fixed up as much as I can not only before submission, but so that i could make sure i properly understood the concepts. However the prospect of losing the few limited marks we'd gained meant my partner didnt bother to help me try fix things after the deadline. Hence I gave up a day after the deadline of assignment 3 and still don't fully understand things :( |
| Labs etc should be introduced as the assignments are challenging not due to the content but due to unclear and unfamiliar instructions. Help sessions should be provided by tutors during assignments released period where tips and direction might actually help some students who are struggling. |
| More exercises addressing the practical differences when it comes to working in an OS environment. Tutorials, tool–building exercises, basic coding exercises that look into this. I intend to prototype these. E.g.: Given a syscall implementation, how can you write user–code to test this? How can you write and include your own kernel test commands (i.e. extend the test parts of the kmenu). Broaden/deepen resources available to get a command of the ancillary understandings (such as gdb specific for the course). support primarily around git with private gitlab repos. Submissions based on a commit as an option. This could correspond with relatively simple weekly exercises I feel that this course largely on the notion that it's third year + "sink or swim". My personal opinion acknowledges there's a time and place for this, but I feel there is too much emphasis on this approach. |
| Not a focus for this course but i think that the uni should be encouraging students to work with git not svn. this should be addressed better in first year subjects and maybe even done in the first week when students are learngin the basics. I dont know what the new comp courses involve but SC is a must have skill for developers. Im not sure if the idea was to learn how to work in a team and pair programming but i dont think that the assignments necessarily need to be done in pairs. i would be happy to do them all individually, but it was helpful discussing ideas with a partner. |
| the timing was quite off especially early on in the course with the assignments. assignment 2 bonus marks were the same week as the tutorial. additionally it seemed a lot was not explained for assignment 3 so it was quite difficult to get started. the os161 specifics seemed to be glossed over somewhat |
| Move the slide about assignment walkthrough from extended lecture to main lectures. I often couldn't find them till too late. |
| I think fortnightly labs or weekly labs experimenting with different parts of the OS system and reviewing code would be very helpful. The tutorials in itself mainly regurgitated solutions to the question and while a good place to ask questions – did not feel like I was doing a lot every week. Also it was a bit hard to find help on assignments unlike when I had labs for classes and although the online forums were quite useful – there were bugs I couldn't find the answer to and was hard to explain online. |
| This is entirely aimed at the school of CSE. When Kevin had to drop out of the course he shouldn't have had to deal with the aftermath. The school should've stepped in and actually showed some direction. When I got the email from Kevin it was so unclear who was actually running the course or what was happening. If someone like Alex or some other lecturer had stepped in instead of having the course pretty much run by tutors with no leader. |
| Assignment marking being way too nitpicky and inconsistent |
| More help / resources for the assignments. |